Using Geometric Mean (or CAGR) as an Alternative to IRR (Updated May 2024)
The internal rate of return (IRR) and compound annual growth rate (CAGR) are both metrics used to analyze investment returns. They’re both commonly used in commercial real estate financial modeling, but what’s the difference? When should you use IRR and when should you use CAGR to model your cash flows?
Read this deep dive to learn the differences between the two metrics, how they both work, which is better for which scenario, and more!
Note from Spencer and Michael: This is another post in a growing series that we call ‘International CRE’. Written by CRE professionals based outside of the United States, this series is a collection of deep dives into various CRE topics relevant to real estate professionals all over the world. One of the reasons we love the International CRE series is that things are not done the same in one country to the next, and this series highlights those differing perspectives.
This particular post is written by our friend Padmaa Iyer. Padmaa is an India-based Real Estate Fundraising Strategist and Chartered Accountant. She is also a long-time A.CRE reader and graduate of our Accelerator Program. A huge thank you to Padmaa for sharing her knowledge with the A.CRE community!
A Sanity Check on the Return Metrics with regard to Cash Flow Patterns
Let’s start at the beginning.
Why do you make a financial model?
To check if the gains of a deal that you expect hold true against a rigorous run of the numbers as well. To check whether the proverbial returns stand the test of all the risks involved.
And how do you measure the overall returns?
This is usually done with these two staples:
- Multiple of the Invested Capital
- An Annualized Return Rate – mostly the IRR/sometimes the CAGR
MULTIPLE: This one is pretty obvious. It’s the most important measure for any business. The multiple tells us how much the investment gives back in gross terms.
For example: if you invested $100 and got back $500, that means you made 5x on your investment.
But this multiple ignores TIME – the most expensive input in any investment. So we must also look at an annualized rate of return so as to see if the investment is worth the time and money.
ANNUALIZED RETURN RATE: While IRR is often the go-to metric for an annualized return, there is an alternative that will offer a more sober view of the returns: the Geometric Mean (GM), which is synonymous with CAGR.
Let’s dig in a little more into these 2 metrics to find out:
- What’s the difference between IRR & CAGR?
- How do IRR & CAGR grow money?
- Which one is better – IRR or CAGR?
- IRR has its own relevance though!
WHAT’S THE DIFFERENCE BETWEEN IRR AND CAGR?
Let’s examine the 3 scenarios below.
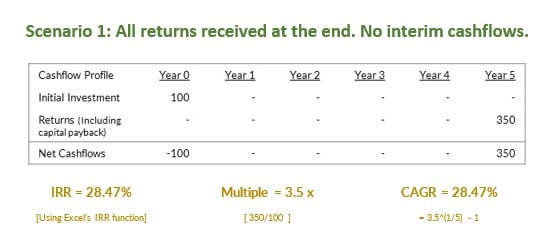
Scenario 1: All returns received at the end. No interim cash flows.
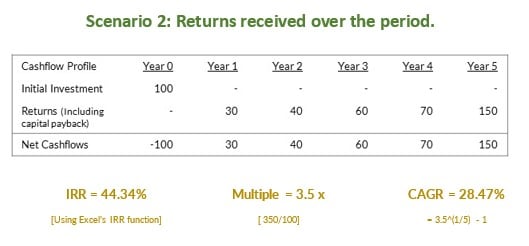
Scenario 2: Returns received over the period.
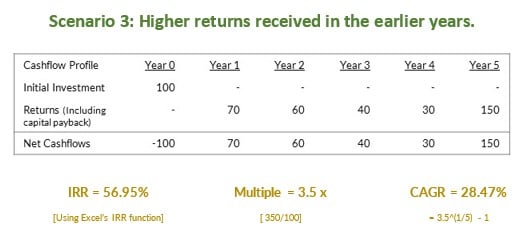
Scenario 3: Higher returns received in the earlier years.
So, what can we observe from these scenarios?
- IRR = CAGR when there are no interim cash flows.
- IRR increases as cash flows are received earlier in the timeline though total return remains the same.
- There’s no change in the CAGR in all the 3 scenarios.
Quick note from Spencer: If you are familiar with the MIRR function in Excel, the CAGR is the equivalent of using the MIRR with a 0% reinvestment rate.
HOW DO IRR AND CAGR GROW MONEY?
IRR:
IRR presumes that all the cash flows received will be reinvested at the same IRR rate.
If money is received earlier, it will earn compounding returns at that same IRR until the end of the investing period.
For example, in Scenario 2 cash inflows are expected to get reinvested and grow at the same IRR for the remaining period and thus gives Total Cash Inflows of 626.57.
This includes actual money from the investment of only 350 whereas the balance of 276.57 is the notional income we might have earned elsewhere by reinvesting at the same return rate as the IRR!
CAGR:
Meanwhile CAGR doesn’t care about the timing of the interim returns. Instead, CAGR grows the initial investment at the CAGR rate.
Of course, to calculate the CAGR, we need to know the total returns and the time taken to earn them.
In the example, 100 grows by 28.47% every year to finally become 350, irrespective of how much of this total amount of 350 is received when within the timeline.
i.e., 100 * (1 + GM rate) ^ 5
There is no fluff of any notional income received from reinvestment elsewhere at the same rate!
WHICH ONE IS BETTER: IRR OR CAGR?
The above analysis clearly tells us that in a case where the cash flow pattern is highly unpredictable, it’s better to rely on CAGR to get a real sense of what the likely return rate is.
For instance, cash flow patterns are typically uneven in a build-to-sell model. There is cash outflow for initial investment, followed by some inflows on account of advance sales tokens received, again followed by heavy outflows as the construction picks up speed along with inflows owing to sales installment collections and fresh sales.
Conclusion
IRR is a mainstream metric and has its own relevance. Sometimes the only feat some people are able to pull off in a spreadsheet is to calculate the quick and dirty IRR!
IRR has a quicker recall value and wider appeal, though. In most cases, your fellow investors will understand the value of your deal only in terms of IRR.
Also, there are some situations where IRR serves a purpose like no other.
For example, a waterfall distribution of equity returns based on IRR thresholds.
In the tiered distribution structure, at each tier, return is calculated on the outstanding capital using the APY.
Once the pay-outs are made corresponding to the outstanding capital and the accrued returns, the remaining undistributed cash flows go to the next tier, to be distributed in the same manner but now with a higher expected return rate.
At the end of every tier (except the last one), if we calculate the IRR, it is equal to the applied APY rate and offers us a great sanity check thus ensuring a controlled distribution at every stage.
IRR serves here as a good cross-check tool.
For A.CRE Accelerator members, check out Michael’s course on development cash flow modeling here to learn more about these metrics and how to model them yourself.
Finally, we suggest looking at some of our other free resources to help you in your CRE journey. We highly recommend you check out the A.CRE AI Assistant. This tool can be an invaluable tool for CRE professionals looking to understand and apply financial metrics like the IIRR and CAGR. By leveraging this AI tool, users can automate parts of their financial modeling, ensuring accurate calculations and interpretations of IRR and CAGR in various investment scenarios.
You can also check out some of our other international CRE tutorials here:
- Why CRE Deals May be Better Off Following a Project Finance Structure
- How to Draw Up a 3-Part Financial Statement from your Financial Model
- How this Land Aggregation Strategy Helps Developers Raise More Debt and Scale Up Fast


